ionic.zone - a site about all things Ionic
-
First published: December 2017
Remote Debugging Ionic apps
When you use ionic serve to run your application in the browser, your browser’s DevTools can be used to debug your app. You can:
- View console logs
- Show history and details of Network requests
- Inspect elements, HTML, JavaScript or CSS
- Inspect Storage, Cache, Manifest or Service Workers
- Profile your app for Performance or Memory problems
When testing a Debug build of your app on emulators, simulators or real devices with ionic cordova run ios|android or similar (like ionic cordova emulate or after distributing a test version built with ionic cordova build via a third party beta distribution service), your app is not running directly in a browser any more. It is executed in the WebView of Cordova.
Fortunately, you can set up development devices for remote debugging with your desktop browser to use the debugging functionality as well.
Android
Android Remote Debugging with Chrome
Remote Debugging for Android happens with the Chrome DevTools you are already familiar with from usage on desktop. It can be used with a physical Android device or Android emulator.
Chrome of course works on all platforms like Windows, macOS or Ubuntu Linux.
Preparation
- Windows only: Install the necessary USB drivers.
- Ubuntu Linux only: Install the
android-tools-adbpackage withapt-get - Connect your physical device with a USB cable.
- Install Chrome for Android on your device or emulator if is not already present.
- Enable developer options and debugging on your device or emulator:
Settings > Developer Options > Enable USB Debugging
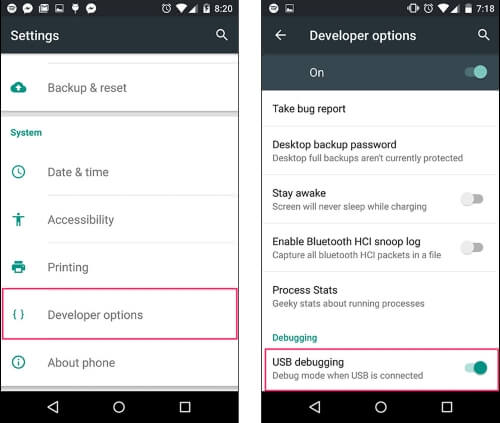
- If this option is missing, first activate developer options:
Settings > System (Android 8+ only) > About phone > Tap Build number 7 times.
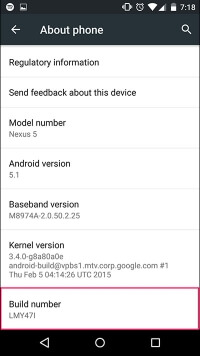
- If this option is missing, first activate developer options:
Debugging
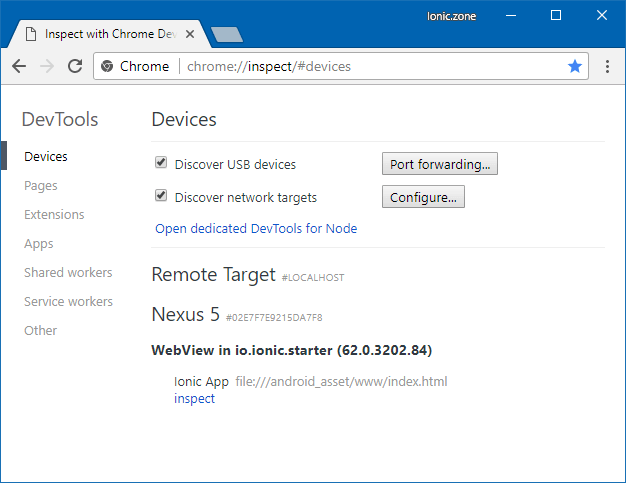
Now Chrome on your desktop machine should discover your device and the WebView inside your app:
- Open chrome://inspect (or via
⠇> More tools > Remote devicesin a running DevTool instance) - The Devices list should contain your device with the WebView of your app:
- The first time you execute this process with a combination of mobile device and desktop computer, you will have to accept a “Allow USB Debugging” prompt on your device.
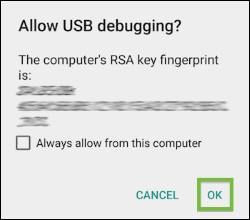
By clicking “inspect” next to your WebView you can now open the DevTools for your app and use all its usual functionality. You will also see a “Screencast” of your app next to the DevTools panels for navigating your app and selecting elements.
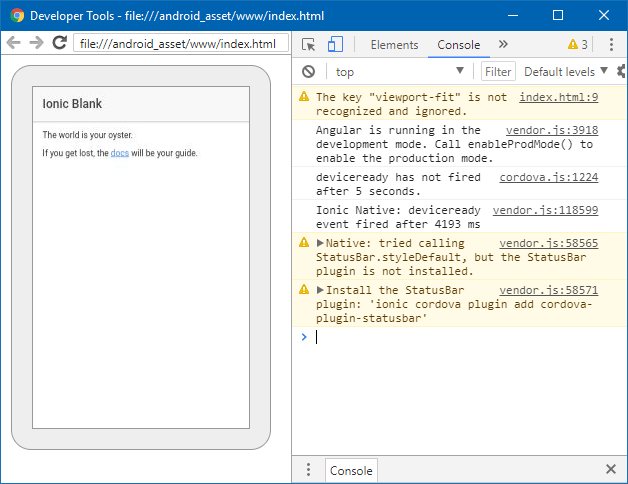
Your first stops will probably be the “Console” and “Network” tabs to look for warnings or errors that can tell you why your app is not looking or behaving like it should.
iOS
iOS Remote Debugging with Safari (macOS only)
macOS offers Safari Web Inspector as the tool to remote debug iOS apps on physical iOS devices but also simulators. You use the Safari Develop menu to find your app and start the debugging session.
Safari is unfortunately only available for macOS and can not be installed on Windows or Ubuntu Linux.
Preparation
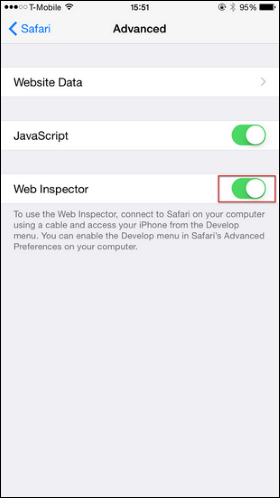
- Navigate to
Settings › Safari › Advancedon your iOS device and enable the Web Inspector.
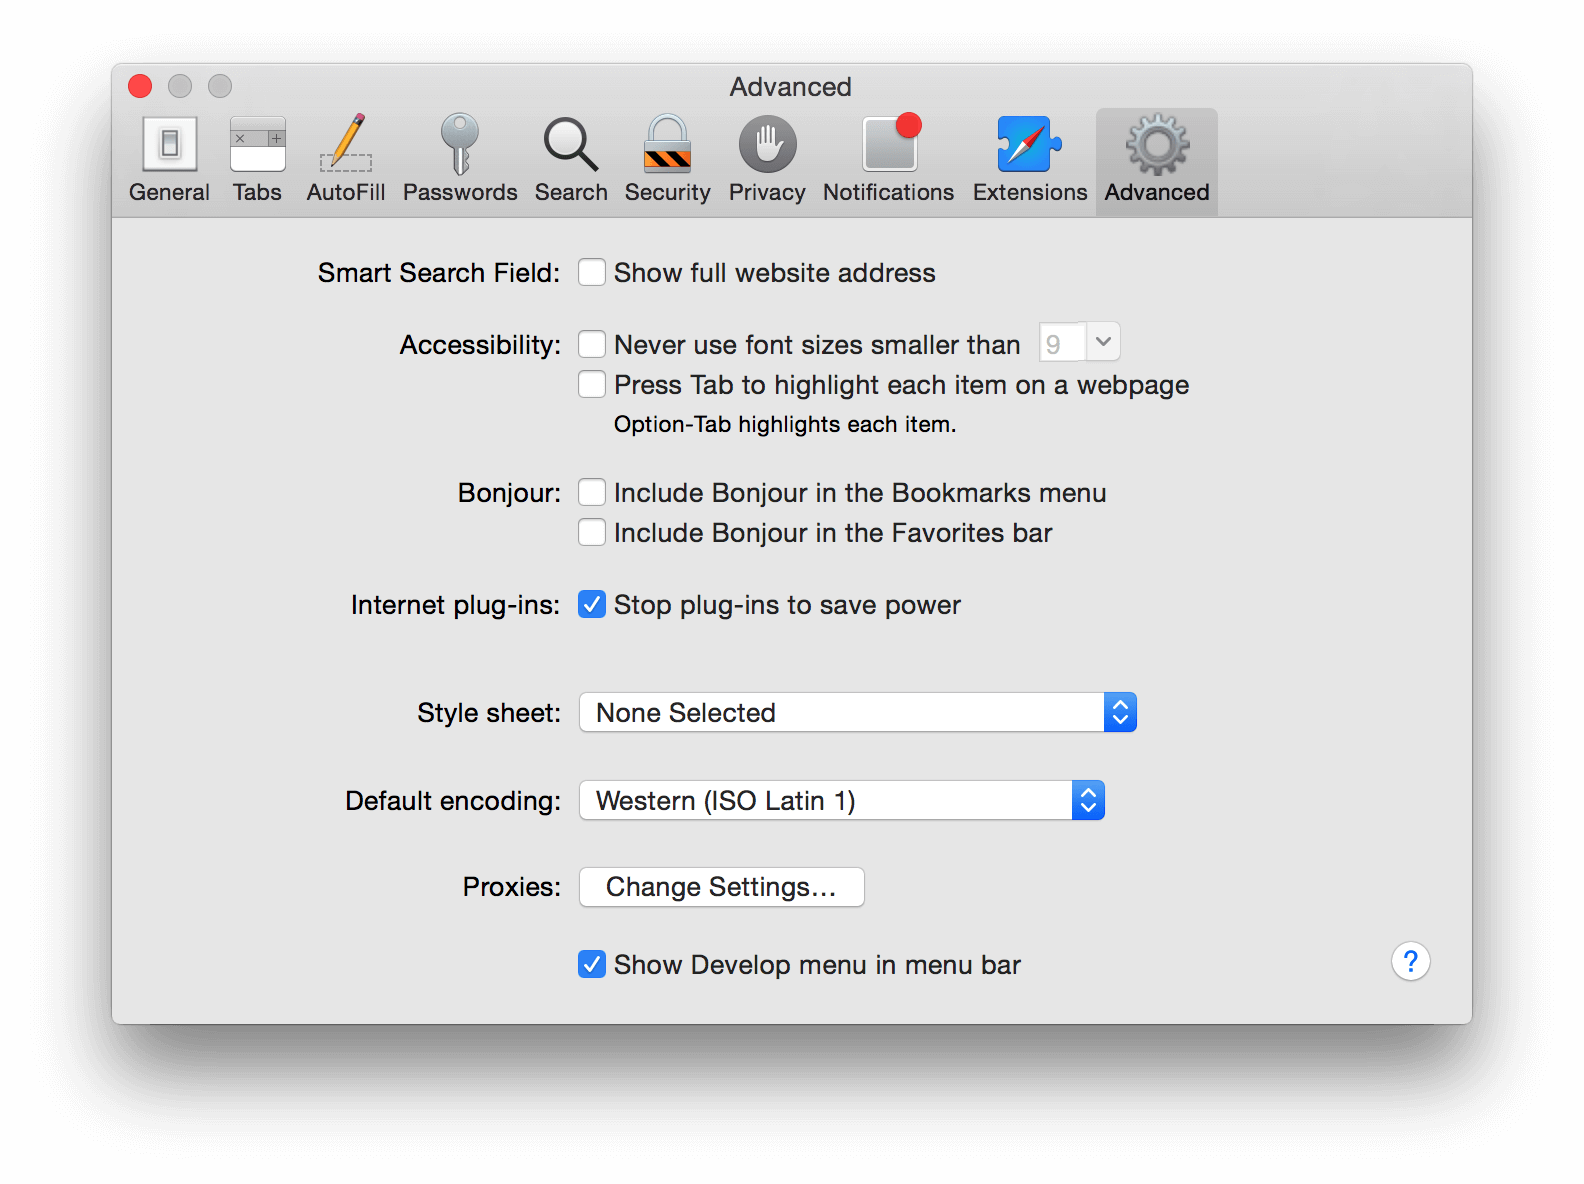
- Navigate to
Preferences › Advancedin Safari on your Mac. Check “Show Develop menu in menu bar” option at the bottom.
- Connect your physical iOS device to your Mac
- Connect your physical device with a USB cable.
- Since macOS 10.12.4+, Xcode 9+ and iOS 11+ you can connect to your device wirelessly.
Note that you can not deploy your app to the device wirelessly with Ionic or Cordova CLI yet.- Connect your device with a USB cable.
- Select “Connect via network” in your device settings in Xcode (
Window > Devices and Simulators > Devices). - Unplug the USB cable, a “globe” icon next to your device name indicates that it is now connected wirelessly.
- Install Safari Technology Preview.
- Continue with this guide, use Safari Technology Preview in place of Safari
Debugging
Now Safari on your Mac should be able to see your app running on your device:
- Navigate to the
Developmenu in Safari, and select your device: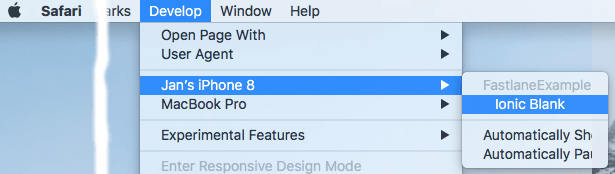
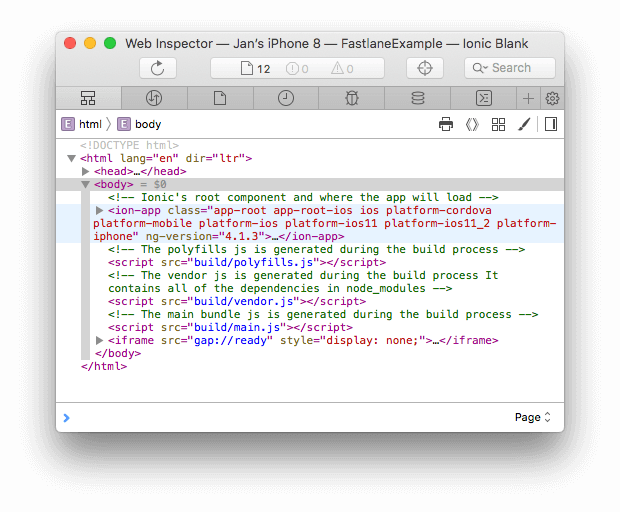
- Click on your app running on the device that you want to debug.
It will open a Web Inspector window for your app, showing the usual developer tools functionality, hovering over elements in the “Elements” view will highlight them on the device.
Your first stops will probably be the “Console” and “Network” tabs to look for warnings or errors that can tell you why your app is not looking or behaving like it should.
-
First published: December 2017